
Austin Real Estate Market Stats April 2015 v 2016: Where did Austin Increase 33%?!
May. 24. 2016
Hello, hello!
It has been a while since I shared some market updates with you, so I was doing a little researching–and decided to share some interesting finds on the Austin market (for the month of April, 2016 in comparison to same time last year) as the market is really starting to stir up, school comes to an end & the busy Summer begins from home projects and vacations, to buying and selling.
Some areas have increased from last April as much as 33%, some down 5%, to find out more about which hoods, and where your next investment may need to be…read on.
“The market is hot!” Bet you haven’t heard that yet? (sarcasm).
As I am sure you have noticed: VALUES ARE UP! Taxes are up! Rents are up. Highrises are going up, and travel times are going up…and my clients who purchased only three years ago… Are movin’ on up.

All signs of a booming metro (according to Forbes, Jan 2016) show how much our housing market has increased–and this blog is more so about in what particular areas…
First–to understand what areas I will be referring to in the charts below-You must know the Austin MLS areas. You can choose a particular area to see the stats. I did not break them up by zip code, there are several zips in an MLS area.
Secondly, if you would like data specific to you, not listed in this blog-let me know- I can get it for you. All data comes from the Austin Board of Realtors, based on MLS data (which 99% of home sales are entered into).
Let’s look at Austin as a whole, first. All the Austin Board of Realtors area coverage (from Austin to Dripping Springs, Wimberly and Kyle to Georgetown, Taylor and Cedar Park for example):
| Greater Austin |
Median |
Average |
||||
|
Apr 2016 |
Apr 2015 |
% Change |
Apr 2016 |
Apr 2015 |
% Change |
|
|
List Price |
$282,000 | $269,900 |
+ 4.5% |
$343,647 | $336,725 |
+ 2.1% |
|
Sold Price |
$280,000 | $265,000 |
+ 5.7% |
$338,844 | $330,111 |
+ 2.6% |
|
Square Feet |
1,958 | 1,957 |
+ 0.1% |
2,132 | 2,141 | -0.4% |
|
LP/SF |
$141 | $133 |
+ 6.3% |
$167 | $160 |
+ 4.7% |
|
SP/SF |
$140 | $131 |
+ 6.5% |
$165 | $157 |
+ 5.1% |
|
SP/LP |
99.7% | 99.4% |
+ 0.3% |
99.0% | 98.7% |
+ 0.2% |
|
DOM |
12 | 11 |
+ 9.1% |
45 | 44 |
+ 0.6% |
Note above I bolded “as a whole.” Because when you are just looking at Austin in general, and not including the 5 MSAs surrounding Austin, the numbers are lower.
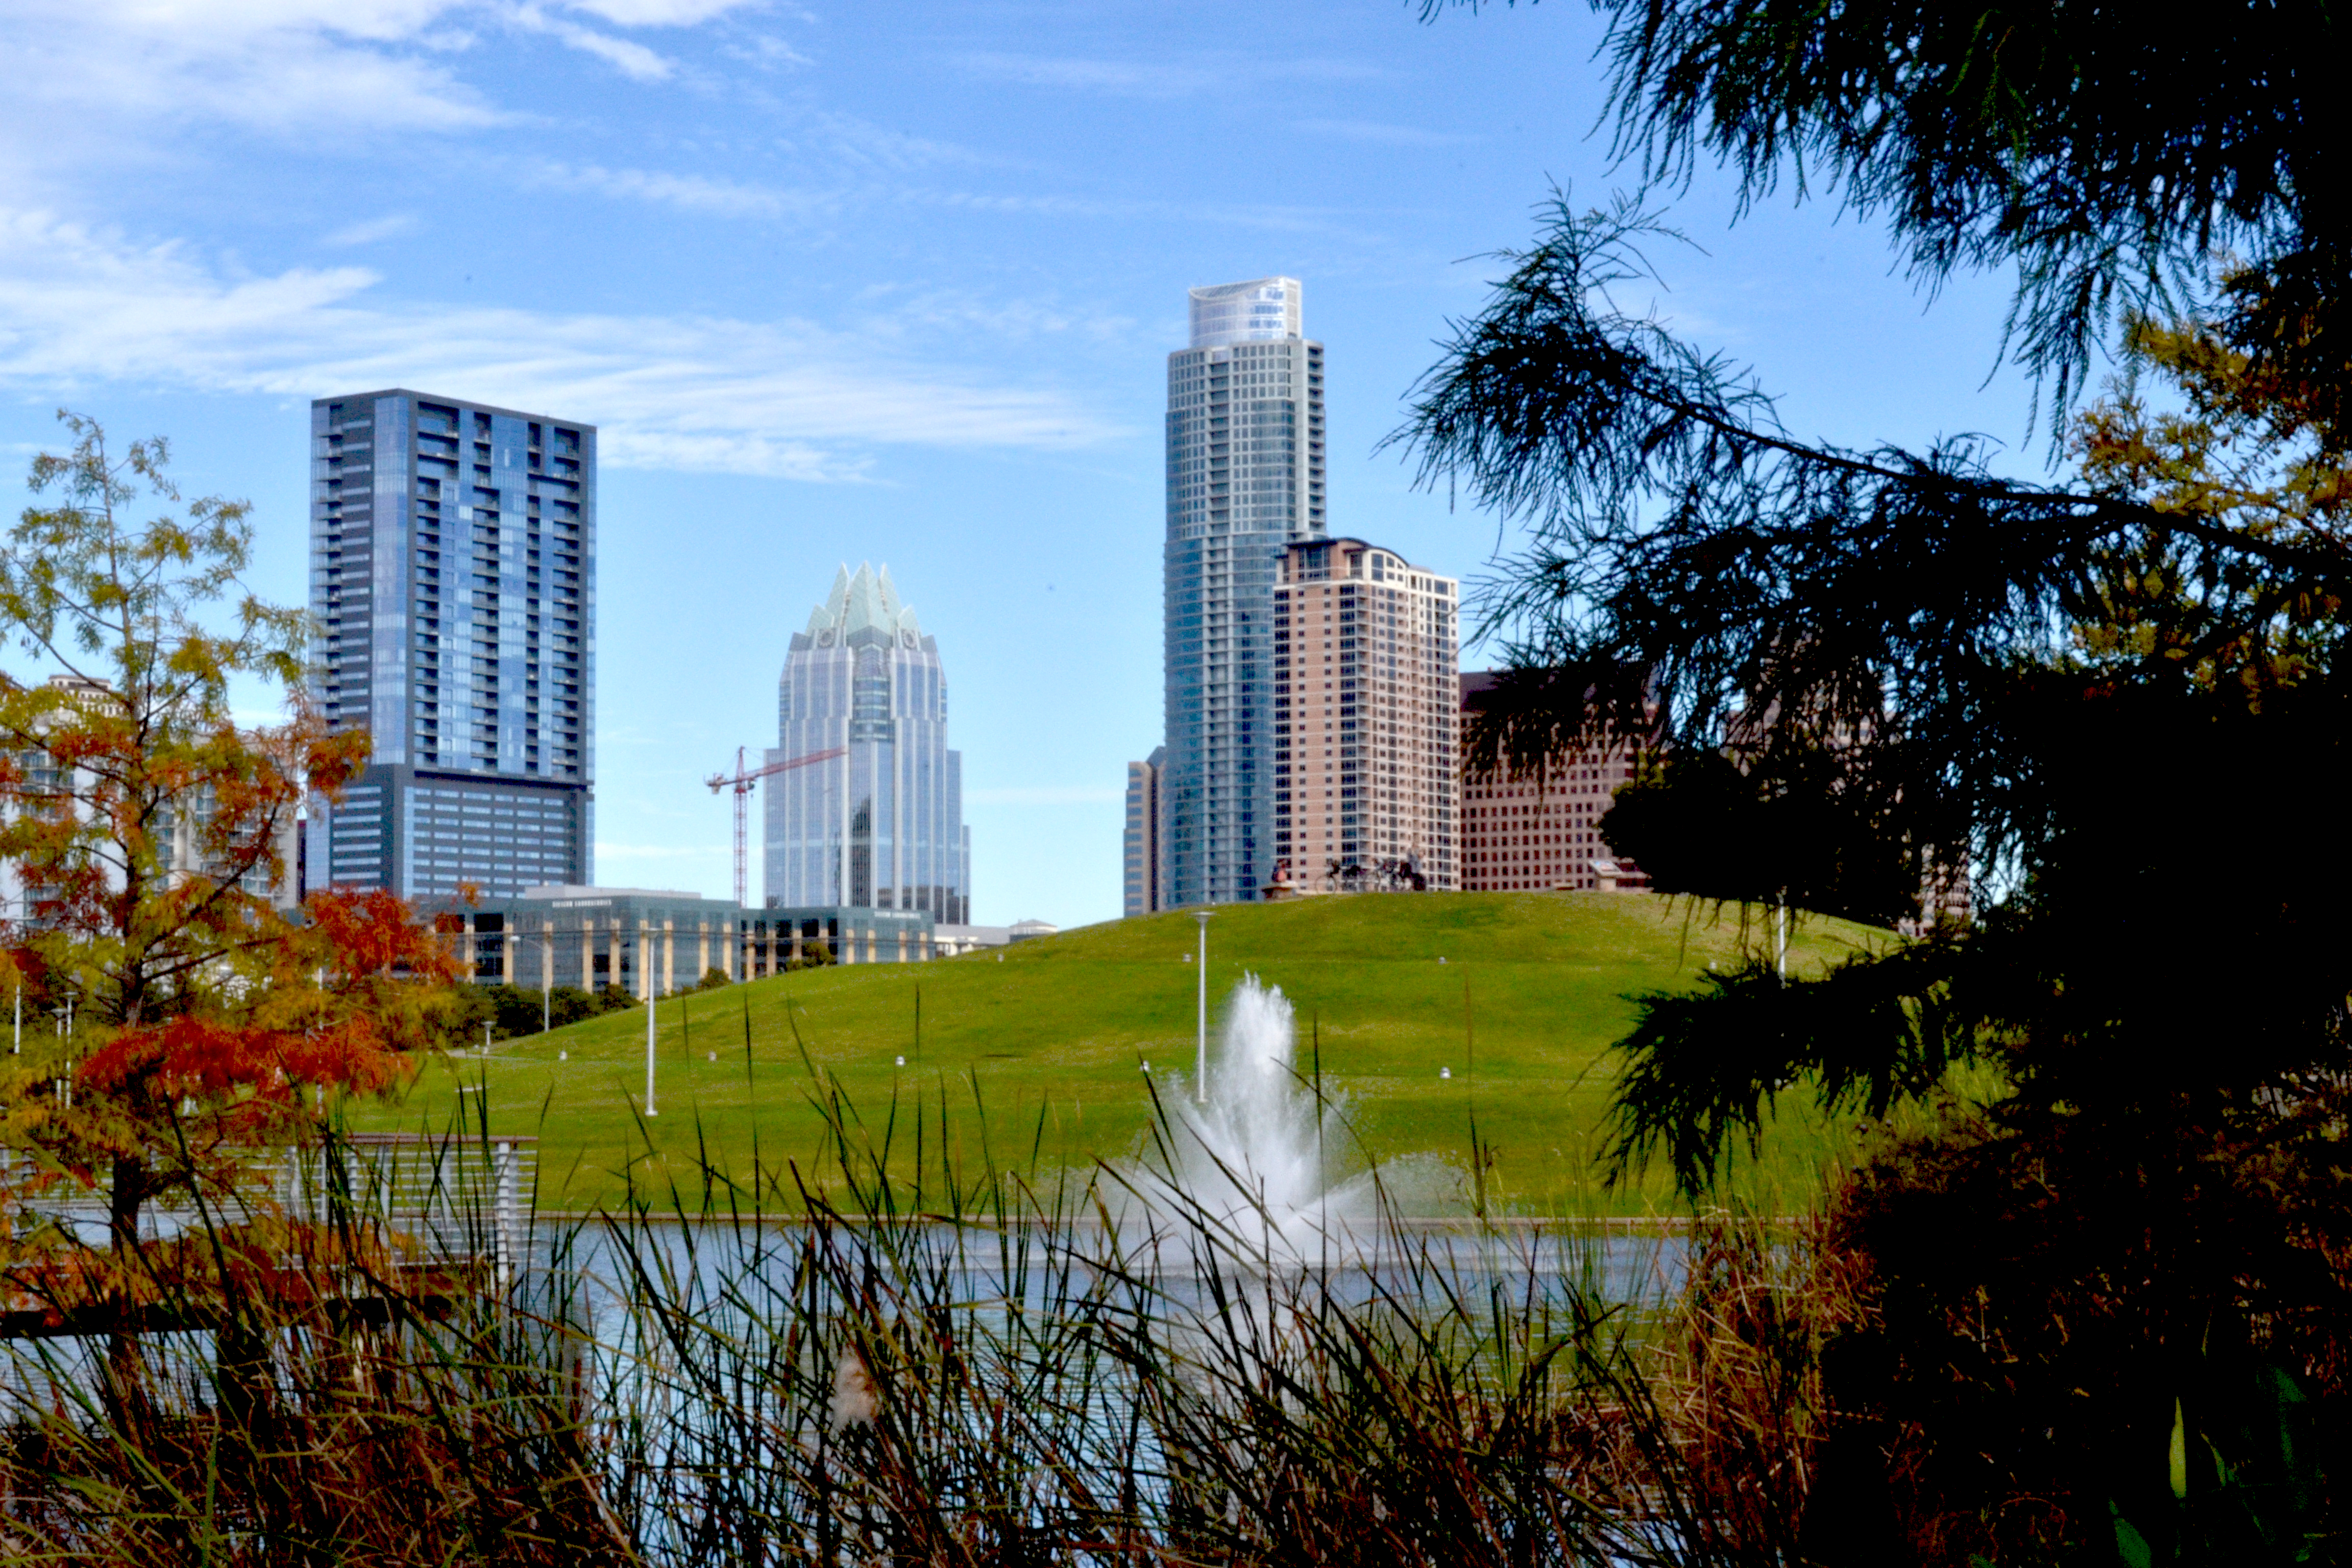
Now, let’s get down to the Austin core…yep DT (downtown).
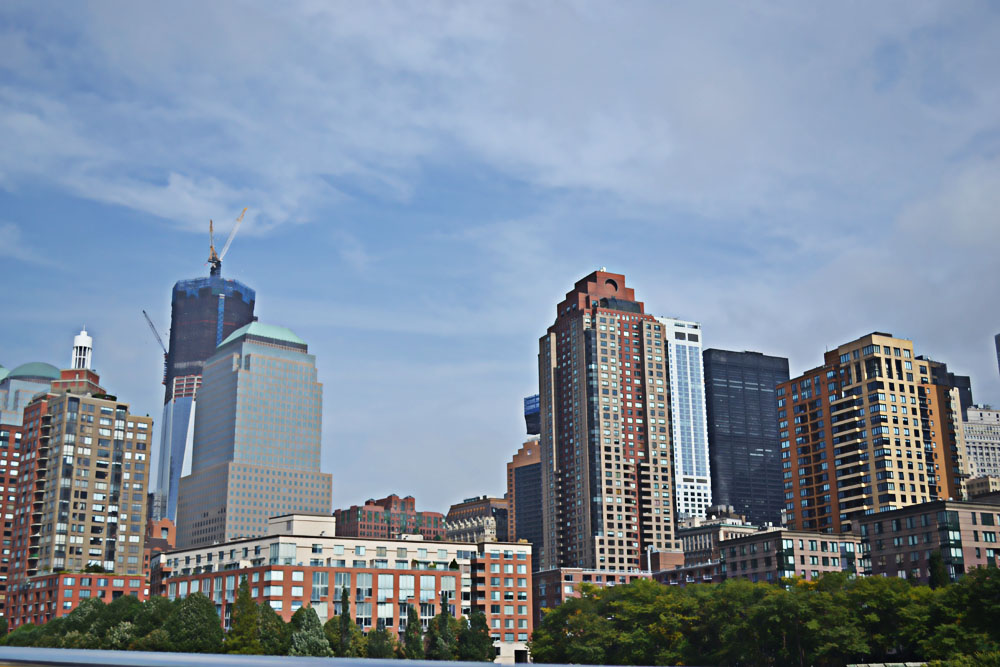
How were prices in April of this year compared to 2016? (Also note we have a few more high rises in the works to be built DT as well as more apartment complexes that are projected and just opened in the last year downtown.
| Median | Average | |||||
| DT AUSTIN | Apr 2016 | Apr 2015 | % Change | Apr 2016 | Apr 2015 | % Change |
| List Price | $397,500 | $434,500 | – 8.5% | $509,920 | $682,700 | – 25.3% |
| Sold Price | $387,500 | $430,000 | – 9.9% | $497,007 | $654,846 | – 24.1% |
| Square Feet | 831 | 1059 | – 21.6% | 960 | 1171 | – 18.0% |
| LP/SF | $506 | $450 | + 12.5% | $523 | $543 | – 3.7% |
| SP/SF | $489 | $435 | + 12.2% | $510 | $526 | – 3.0% |
| SP/LP | 97.9% | 98.0% | – 0.2% | 97.5% | 97.4% | + 0.1% |
| DOM | 23 | 21 | + 9.8% | 42 | 53 | – 21.3% |
Yes, you did see a decrease that I highlighted on percentage changed for our average sales prices, BUT not to be alarmed-as the stats are only comparing downtown to one month vs “the big picture.” Downtown still increased year to year and the other important thing to note is that the square footage listed in April was smaller than that of April 2015, therefore it skews the numbers to look as if there was a decrease–when there is really no area in Austin that has dipped in sales values. And while all signs point to the market steadily increasing–timing could be off in comparison. For example, more people put their expensive condos on the market April 2015 v 2016, but there may be an influx of listings coming the next few months.
CHECK OUT VOLUME IN APRIL ACCORDING TO HOUSING PRICES FOR GREATER AUSTIN:
| Price Range | Quantity | DOM | Price Range | Quantity | DOM | |
| $149,999 or under | 207 | 46 | $500,000- $549,999 | 90 | 48 | |
| $150,000- $199,999 | 424 | 26 | $550,000- $599,999 | 60 | 53 | |
| $200,000- $249,999 | 517 | 29 | $600,000- $699,999 | 94 | 73 | |
| $250,000- $299,999 | 425 | 49 | $700,000- $799,999 | 52 | 56 | |
| $300,000- $349,999 | 312 | 46 | $800,000- $899,999 | 28 | 41 | |
| $350,000- $399,999 | 260 | 51 | $900,000- $999,999 | 25 | 53 | |
| $400,000- $449,999 | 176 | 71 | $1,000,000 or over | 47 | 67 | |
| $450,000- $499,999 | 138 | 53 | Total: | 2,855 | 45 |
| Apr 2016 | Apr 2015 | % change | 2016 YTD | 2015 YTD | ||
| Sold Listings | 2,855 | 2,847 | +0.3% | 9,527 | 9,244 | +3.1% |
| Volume | $967,399,611 | $939,825,174 | +2.9% | $3,141,290,016 | $2,950,183,540 | +6.5% |
As I mentioned above, some of the decreases I am seeing in specific central Austin areas (downtown, clarksville, west lake etc.) more so have to do with scarcity of inventory and higher prices than lack of desirability. Some of these areas take very specific buyers; for example, the average sales price in charming Clarksville is $910k!
| INVENTORY 1B | Apr 2016 | Apr 2015 | % change | 2016 YTD | 2015 YTD | |
| Sold Listings | 24 | 28 | –14.3% | 69 | 94 | -26.6% |
| Volume | $11,928,174 | $18,335,700 | -34.9% | $45,552,206 | $58,488,050 | -22.1% |
Let’s talk about North Austin (aka: area 2n; aka 78758, 78753). With the growth of the Domain and many tech companies moving and expanding in North Austin, it is no wonder over one year’s time the average sales price has shot up 19.5%!
| Area 2N | April-16 | |||||
| Median | Average | |||||
| Apr 2016 | Apr 2015 | % Change | Apr 2016 | Apr 2015 | % Change | |
| List Price | $230,000 | $199,900 | + 15.1% | $226,642 | $187,470 | + 20.9% |
| Sold Price | $237,500 | $206,390 | + 15.1% | $227,839 | $190,629 | + 19.5% |
| Square Feet | 1425 | 1415 | + 0.7% | 1446 | 1363 | + 6.1% |
| LP/SF | $148 | $131 | + 12.7% | $155 | $135 | + 14.8% |
| SP/SF | $153 | $138 | + 10.8% | $156 | $137 | + 13.8% |
| SP/LP | 100.4% | 100.7% | – 0.3% | 100.5% | 101.3% | – 0.8% |
| DOM | 4 | 4 | 0.0% | 33 | 10 | + 229.2% |
Click HERE to see the map breakout of areas. This is also the area I personally live in (what! what!) want to know more? Contact me!
Let’s explore some more areas and evaluate home prices…read on…
When you head North east to the MLS area: NE (out toward Parmer and 290… near Samsung…and yes an old landfill) you have some new developments on the rise. If you are commuting to N. Austin, I think this can be a great buy for those who:
1. Solely want new construction (various builders and neighborhoods) at an affordable price and/or
2. As an investment–the area only has more acreage and room to grow with easy access to large companies, toll roads and highways and if staying E. not too bad of a commute into central Austin. Great for rental property or to live in, and hold.
| Area NE | ||||||
| Median | Average | |||||
| Apr 2016 | Apr 2015 | % Change | Apr 2016 | Apr 2015 | % Change | |
| List Price | $225,000 | $192,900 | + 16.6% | $239,439 | $199,669 | + 19.9% |
| Sold Price | $226,021 | $193,900 | + 16.6% | $237,895 | $198,490 | + 19.9% |
| Square Feet | 1739 | 1928 | – 9.8% | 1876 | 1939 | – 3.2% |
| LP/SF | $134 | $111 | + 20.7% | $131 | $107 | + 22.4% |
| SP/SF | $134 | $109 | + 22.6% | $130 | $107 | + 21.8% |
| SP/LP | 100.0% | 100.0% | 0.0% | 99.6% | 99.7% | – 0.1% |
| DOM | 6 | 5 | + 20.0% | 16 | 19 | – 13.8% |
Which neighborhoods and builders am I referring to exactly in NE Austin? Check out the homes in this area above: HERE. There are a lot of new neighborhoods (and some only a few years old, still growing in this area). This area mainly comprises 78754 and 78753 and extends East to Manor. Some of the neighborhoods are Bellingham Meadows. Enclave of the Springs, Walnut Creek Enclave, Stirling Bridge, Parkside at Harris Branch, Pioneer Crossing, Pioneer Crossing West. In price points ranging from the affordable starter home, $205k, only a few years old to brand new homes you can pick finishes etc. around $350k. (here’s an old blog on purchasing new construction HERE).
And how is East Austin (area 3, aka 78723) fairing in home sales? Well, there is no doubt about it, the development of Mueller has increased housing not only in the diverse and eclectic, new community (that is still developing), but the surrounding neighborhoods such as Windsor Park, The Grove, University Hills, Cherrywood and St. John’s have all seen an increase in sales due to Mueller.
There are plenty of homes built in the late 60’s, updated and renovated, but like many areas of Austin–tons of new (and not so “affordable” developments can be found…like, HERE)!
| Median | Average | |||||
| AREA 3 | Apr 2016 | Apr 2015 | % Change | Apr 2016 | Apr 2015 | % Change |
| List Price | $375,000 | $309,900 | + 21.0% | $371,796 | $315,289 | + 17.9% |
| Sold Price | $372,500 | $300,000 | + 24.2% | $370,279 | $311,335 | + 18.9% |
| Square Feet | 1579 | 1508 | + 4.7% | 1593 | 1483 | + 7.4% |
| LP/SF | $244 | $207 | + 18.0% | $238 | $216 | + 10.2% |
| SP/SF | $244 | $206 | + 18.4% | $238 | $213 | + 11.8% |
| SP/LP | 100.0% | 100.0% | 0.0% | 99.7% | 98.6% | + 1.1% |
| DOM | 8 | 11 | – 31.8% | 41 | 43 | – 4.0% |
Perhaps two of the hottest Austin areas are South of the river and East of 35 (78741 and 78744).
One area in particular, {in my opinion that is undervalued and coming around–great rental investment opportunities} I have been telling many people who want to invest in is: 78744..or aka Area 11 on the map, check out what homes you can find HERE.
| Median | Average | |||||
| Apr 2016 | Apr 2015 | % Change | Apr 2016 | Apr 2015 | % Change | |
| List Price | $199,900 | $190,303 | + 5.0% | $211,912 | $174,797 | + 21.2% |
| Sold Price | $203,110 | $186,393 | + 9.0% | $211,246 | $172,907 | + 22.2% |
| Square Feet | 1313 | 1466 | – 10.4% | 1590 | 1545 | + 2.9% |
| LP/SF | $144 | $120 | + 20.0% | $139 | $116 | + 20.2% |
| SP/SF | $149 | $120 | + 25.1% | $139 | $114 | + 21.4% |
| SP/LP | 100.0% | 99.4% | + 0.5% | 99.8% | 99.2% | + 0.6% |
| DOM | 8 | 17 | – 51.5% | 30 | 59 | – 48.7% |
You can find everything from grandma’s house to new construction in this area, above, that’s for sure.
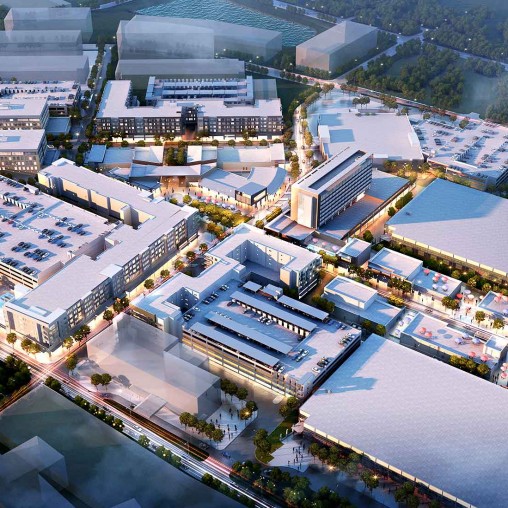
However, if you are willing to spend a bit more—and you heard the news of Oracle relocating to East Austin on 27 acres, East of DT, overlooking Lady Bird lake… then this may be the area for you, (but the cat is out of the bag on this area–as it has increased already since last year 33.2%). Holy moly…one of the largest increases of all the Austin areas. With the boardwalk completion, easy access to airport, DT, ACC campus and more, it is no wonder people are choosing to invest in this area.
| Median | Average | |||||
| Area 9 | Apr 2016 | Apr 2015 | % Change | Apr 2016 | Apr 2015 | % Change |
| List Price | $242,450 | $224,500 | + 8.0% | $251,058 | $193,749 | + 29.6% |
| Sold Price | $242,750 | $217,000 | + 11.9% | $253,746 | $190,471 | + 33.2% |
| Square Feet | 1122 | 1245 | – 9.9% | 1233 | 1239 | – 0.4% |
| LP/SF | $206 | $159 | + 29.8% | $209 | $153 | + 36.2% |
| SP/SF | $206 | $143 | + 44.2% | $210 | $150 | + 39.9% |
| SP/LP | 100.0% | 97.6% | + 2.5% | 100.4% | 97.9% | + 2.6% |
| DOM | 5 | 20 | – 75.0% | 9 | 37 | – 75.2% |
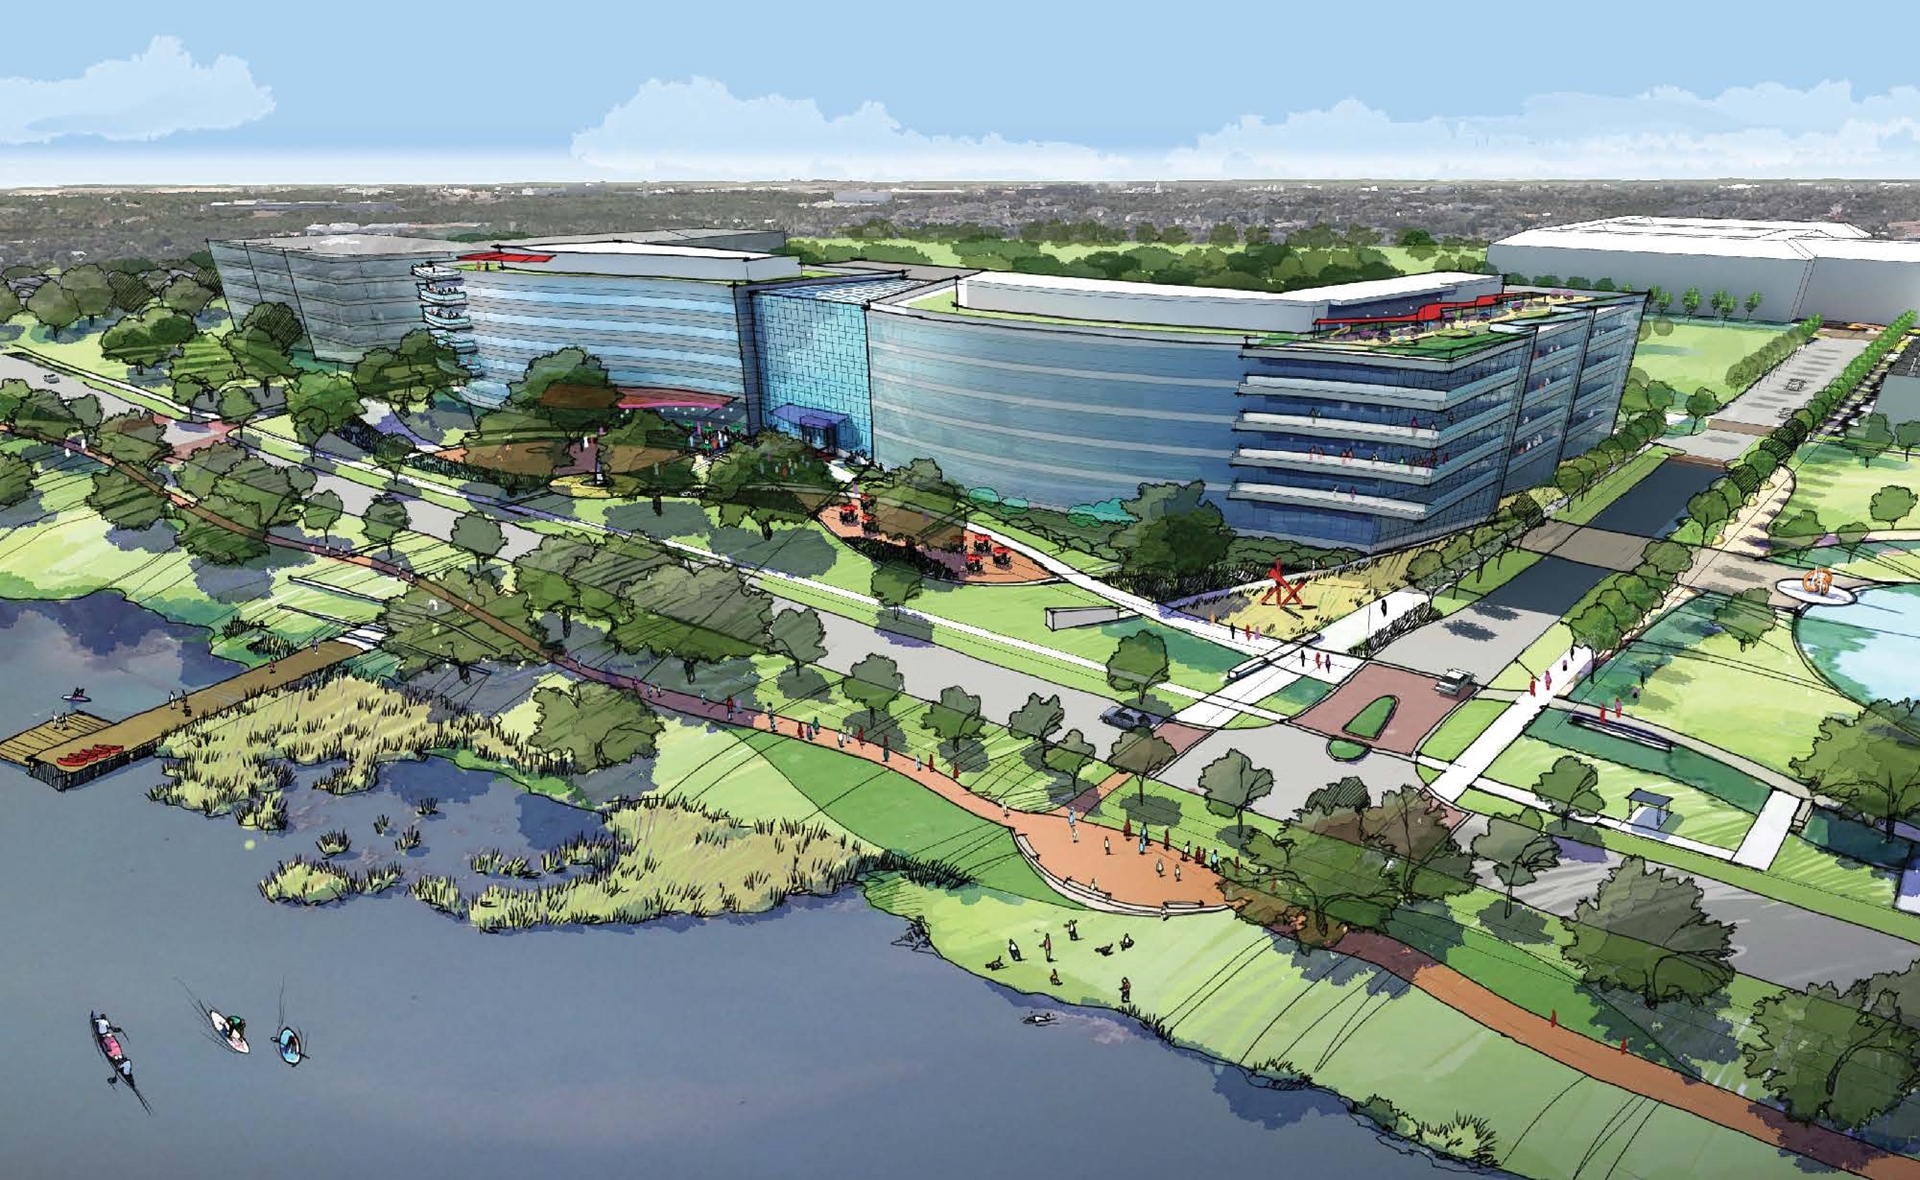 (Artist’s drawing of Oracle campus above)
When evaluating the sold prices from April 2015 to 2016, here’s a few popular areas and if you’d like more specific info like I have above-feel free to contact me and I will send it over (it is just too much to put into one blog).
- Round Rock East and Round Rock West had about a +4% change for April 2015 v2016 (RRW was a little less than RRE with all the growth out East of Austin, w toll roads etc)
- Pflugerville experienced a +5.8%, average sales price under $230k, so quite affordable!
- NW Hills and Great Hills in Austin jumped +13.5% w/ avg sales price around $544k
- The 78745 (or area S of Ben White, N of Slaughter-ish area) is steadily increasing, +4.8%
- 78703 (aka Clarksville or a very desirable central Austin location near DT) actually decreased -5.1%, yet the average sales price in this area for a home in April 2016: $910k
- The UT area (78705, or campus better yet) decreased in April as well, -3.4% w/ avg sales price around $290k
- While DT showed to be down-24.1% in Apr 2016 v 2015, it also decreased in listings volume by 36%, what does $510/sq ft buy you? Check it out…HERE.
- Cedar Park is still growing quite a bit, with an increase of +9.7% and avg sales price at $317k where you can get on avg 2300sq ft too!
- Northern part of Cedar Park & Leander, due to all the growth in N. Austin are at an average sales price of $280k and up +11.7% from 2015 (examples of homes/area HERE)
- Hays County experienced the largest annual gain in home sales in April 2016, with single-family home sales jumping 17.8% year-over-year to 338 home sales.
- Williamson County was the only county in the Austin-Round Rock MSA to experience a decline in home sales in April 2016, with single-family home sales dropping 5.1 percent year-over-year to 816 home sales.
While I didn’t touch much on affordability in this blog, it is still a large issue in our growing metro areas.
Housing affordability includes not only a home’s sale price, but the homeowner’s ability to continue to afford the home as property values rise from year to year. “The Austin Board of REALTORS® encourages homeowners to learn how their home is being appraised and all property tax exemptions they might qualify for. A Central Texas REALTOR® can help homeowners contest their assessment by identifying comparable properties and gathering the necessary background information to formulate an appeal.” -Aaron Farmer, ABOR President
Anyway, thank you for reading–I hope you found these charts helpful and if you have any questions about your specific area, market stats, neighborhood stats, school ratings, home values, etc, please do not hesitate to reach out! To read more about me and contact me click here.
Ashley Brinkman, ABR, GRI @ Realty Austin.